Introduction to XMaxima
Maxima 有三種工作環境: XMaxima, wxMaxima, 及 DOS 環境.
一. 如何啟動 XMaxima
二. XMaxima 指令簡介
4. 基本數學
5. 微分方程
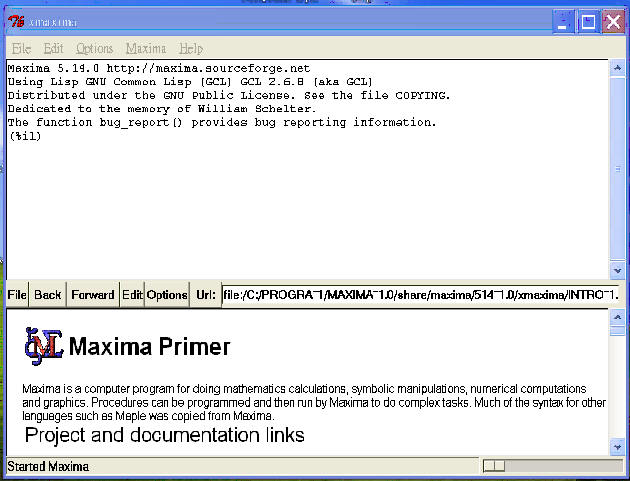
1. 從桌面啟動 XMaxima 或使用開始與所有程式的功能表啟動, 就可以看到下列畫面.
2. 將游標移到 (%i1) 後, 就可以開始輸入 Maxima 的數學指令. 如輸入
integrate(x*log(x),x);
再按 <Enter> 鍵, 就可以執行下列不定積分式的計算
注意:
(a) 指令的最後有分號 ";".
(b) 在 Maxima 中, 自然對數函數 ln x 是用 log (x) 表式.
3. 如果輸入指令
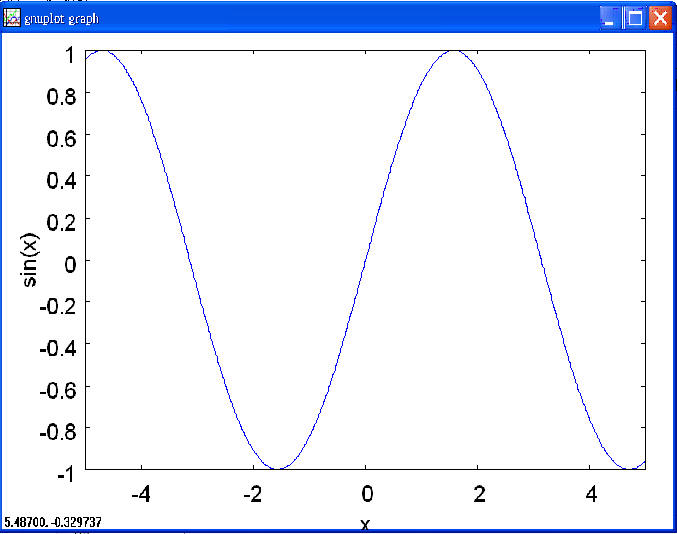
plot2d (sin(x), [x, -5, 5]);
就可繪出 sin x 在[-5, 5] 之間的曲線.
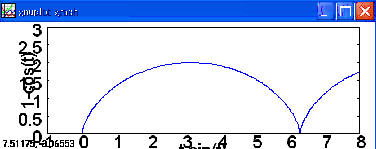
4. 下列指令的例子是使用 200 個點來描繪參數曲線
x = t - sin t
y = 1 - cos t
plot2d ([parametric, t-sin(t), 1-cos(t), [t,0,%pi*4],[nticks, 200]], [x,-1,8],[y,0,3]);
註: nticks 意指描繪畫該曲線時,使用點總數的選項.

1. 基本語法: 每一行 Maxima 敘述須以 ; 作結尾, 依執行效果可分
(1) Maxima 指令式: 執行計算,繪圖,求解等 Maxima 指令.
語法: <Maxima 指令> ;
例如,
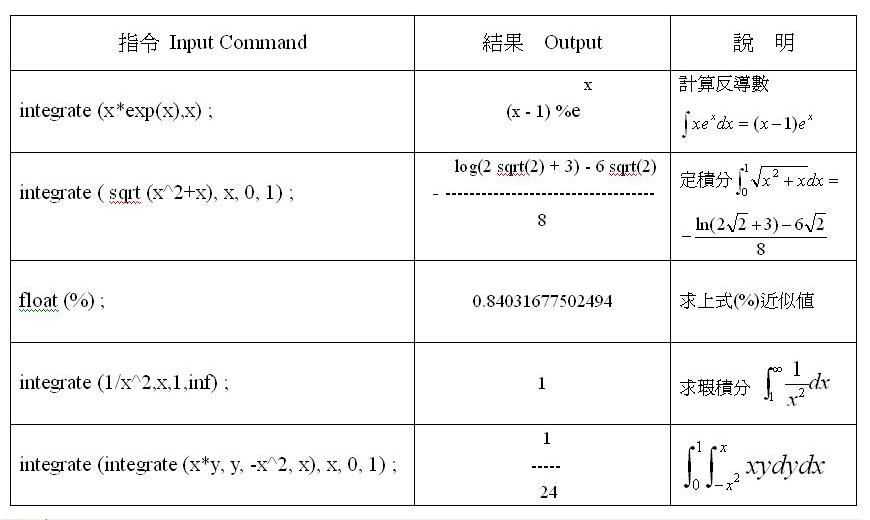
integrate (x * exp(x), x) ; - 求不定積分
factor ( x^2 - 3*x + 2) ; - 因式分解
若沒輸入分號 ;
就按 <Enter>, 則指令不會執行.
此時可再按 ; <Enter>
就可執行指令.
若結尾以符號 $ 取代分號 ; 則計算值不會出現在螢幕上
(2) 指定式: 指定變數的代表值, 代表式, 或方程式等運算式.
語法 <變數名稱 > : <運算式 exp> ;
例如,
a : 10 ; - 將符號 a 指定為 10
b : x^2 - x ; - 符號 b 代表 x^2 - x
運算符號: 四則運算( +, -, *, /), 次方 (^), 自然對數 ( log ), 指數函數 exp (x)
(3) 定義函數
語法: <函數名稱> ( <變數1>, <變數2>, ... ) : = <運算式>
例如:
f(x) := x^2 - 2*x + 3;
g(x,y) := x*y*exp(-x^2-y^2);
範例:
limit (x/sin(x), x, 0, plus);
- 
limit ((x^2-3)/(2*x^2+x-5), x, inf); - inf 指無窮大 (minf指 minus infinity)
diff (tan(x)*cosh(x), x); - tan x cosh x 對 x 取導數
diff (sin(x^2), x, 2); - 微分兩次
(a) 單一自變數函數圖形
plot2d (exp(-x^2), [x, -3, 3], [y, 0, 2]);

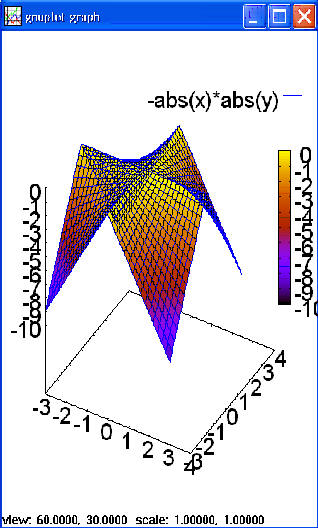
(b) 兩個自變數的函數圖形 (→)
plot3d (-abs(x*y),[x,-3, 3], [y, -3, 3]);
(c) 參數曲線: 下列指令的例子是使用 200 個點來描繪參數曲線
x = t - sin t
y = 1 - cos t
plot2d ([parametric, t-sin(t), 1-cos(t), [t,0,%pi*4],[nticks, 200]], [x,-1,8],[y,0,3]);
註: nticks 意指描繪畫該曲線時,使用點總數的選項. %pi 代表圓周率.
(c)
|
XMaxima 畫圖指令 |
指令說明或結果 |
|
load ( implicit_plot ) $ implicit_plot ([ x^2+y^2=1, x^2-y^2=1], [x,-2,2], [y,-2,2], [gnuplot_preamble, "set zeroaxis"]); |
|
|
load (draw) $ polar( cos(2*theta), theta, 0, 2*%pi) )$ |
Plot a four-leaved rose in polar
coordinates. The interval from 0 to 2*Pi is partitioned into 200 subsegments.
|
|
load (draw) $ polar( sin (8*theta/5), theta, 0, 10*%pi) )$ |
|
|
load (draw) $ x, -5, 5, y, -5, 5, z, -2, 2), surface_hide = true) $ |
|
4. 基本數學
5. 微分方程